Data and measurement
Estimate segregation as people move.
I developed a method that combines mobile-phone locations with Census demographics to estimate racial segregation hour by hour. The analysis covers 18 large U.S. commuting zones.
- 01Estimate population composition
I inferred home tracts from nighttime locations, attached Census demographics, and adjusted for uneven representation in the phone data.
- 02Construct local environments
I weighted nearby observations by distance and time to estimate the racial composition around each location.
- 03Measure change over time
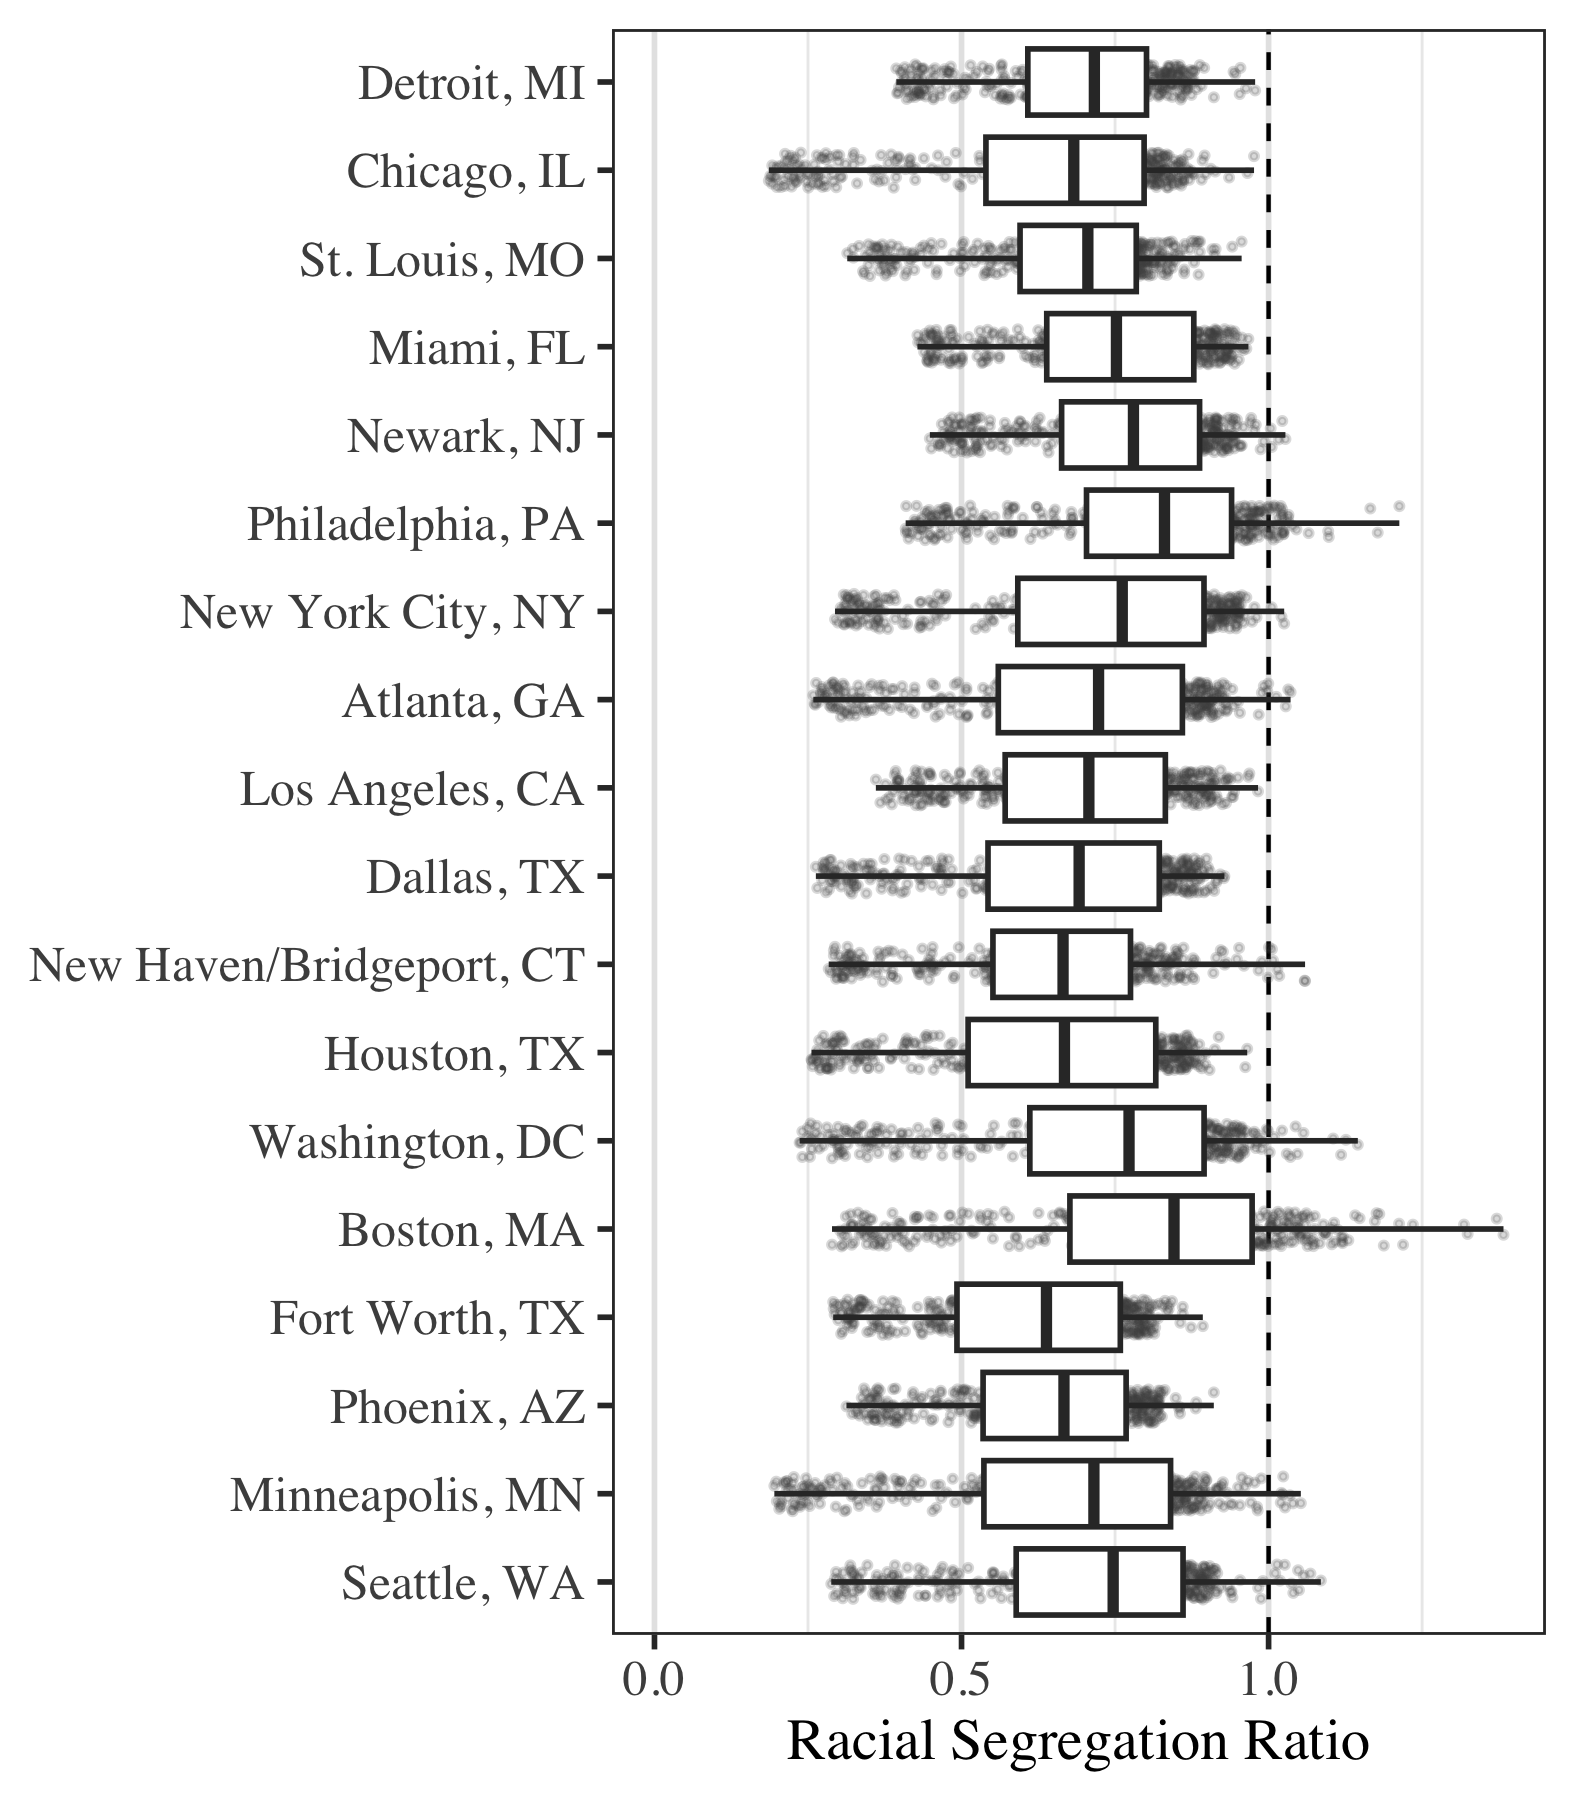
I calculated 428 hourly segregation estimates per commuting zone using 18 days of observations from January 2020, then compared hourly and residential segregation.
Computation
Formulate the calculation as matrix multiplication.
I developed a high dimensional matrix multiplication approach to estimate local populations across space and time. It combines pairwise proximity weights with demographic frequencies, producing the local compositions needed for the segregation index.
Some matrices contain more than a billion elements. I implemented the calculation in C++ with RcppArmadillo and RcppParallel, using R to coordinate data preparation, estimation, and visualization.
From location records to an hourly segregation estimate
Lₕ = Wₕ FₕL̃ᵢₘₕ = Ω(sᵢ − h) LᵢₘₕHₕ = Σᵢ (tᵢₕ / Tₕ) (Eₕ − Eᵢₕ) / EₕF contains adjusted demographic frequencies from inferred home tracts. W contains pairwise weights from Gaussian kernels with σ = 1 km in space and σ = 1 hour in time. Spatial distance includes altitude; Ω weights observations by proximity to the hour being estimated.
Eᵢ is local racial diversity; E is diversity across the pooled weighted frequencies. tᵢ / T is the local environment’s share of that total. I report Theil’s multigroup entropy index H × 100 and use the same spatial kernel for the residential comparison.
Theory and expectations
Turn theoretical arguments into temporal expectations.
I derived hourly and weekday–weekend expectations from three theoretical perspectives on racial segregation dynamics:
- Social isolation: racial segregation persists across daily activities.
- Compelled mobility: segregation declines when people travel beyond their neighborhoods for work and other resources.
- Cosmopolitanism: everyday urban life brings people into more diverse surroundings, including outside working hours.
Findings
The clearest declines coincide with the workday.
I used fixed-effects models to compare segregation across hours and days within commuting zones.
Segregation was highest overnight, declined during weekday working hours, and was generally higher on weekends. This pattern is most consistent with compelled mobility.
Friday and Saturday nights, and the following early mornings, were less segregated than Wednesday at the same hours, offering partial support for cosmopolitanism. Higher weekend segregation offered weaker support for social isolation.
Paper and code
Read the paper or explore the calculation.
Daily Dynamics of Urban Racial Segregation in the United States is available on SocArXiv.
The public replication package includes a runnable demonstration using simulated data.